
Without KPIs ➡ performance indicators, marketing efforts cannot be measured and as such, cannot be improved.
What is the best strategy to improve a company’s marketing efforts? Do you know the current marketing performance within your company? Can you easily figure out which things work well and which don’t?
What are the KPI Performance Indicators in Online Marketing?
A key performance indic ator ( KPI ➡ Key Performance Indicator ) is the measurable value that demonstrates how quickly and efficiently a company can achieve its key business objectives. In the 21st century, most organizations have as their main strategy the use of key performance indicators to achieve their goals.
Selecting the right performance indicator for your business depends on the field in which the activity takes place and which part of the business you want to pursue. It is essential that within an organization each department uses different KPIs to be able to measure progress based on specific business targets.
The next step after establishing and implementing all the right KPIs for your business is to track them in real-time so you can see any changes along the way.
The management of all the chosen KPIs can be done by using a software-based dashboard (dashboard) through which all the information regarding the department, activity, progress, or any other necessary detail can be followed.
How to Choose the Best KPI Suitable for US?
When writing or developing a key performance indicator for the business you own, it is essential to consider how that indicator relates to a specific outcome or objective of the business activity.
In general, key indicators should be customized according to the situation of your business and how it should help you achieve your goals. The steps for choosing a suitable key indicator are:
- Writing a clear goal for each business department.
- Sharing the details of all parties involved.
- Checking weekly or monthly progress
- Checking the actionability of the chosen indicators.
- Their periodic development, to suit the needs of the business, depending on the changes that occur.
- Checking the degree of their achievement.
- Update them according to business needs.
Importance of Key Performance Indicators
KPIs are just as important as achieving your strategy and business objectives. Without establishing key performance indicators, it is quite difficult to measure the evolution of the business over time, and this can lead to decisions based on wrong assumptions.
KPIs are important for the progress of your business, as well as in making informed and strategic decisions regarding your customers.
Their real value consists of a series of actionable ideas that can be removed from the data analysis process. Thus, you will be able to design other strategies to generate more online sales, but also to find out where problems arise in running the business.
Also, the results provided through these indicators can be communicated to all employees in order to be able to join in solving critical problems.
Types of KPI Indicators
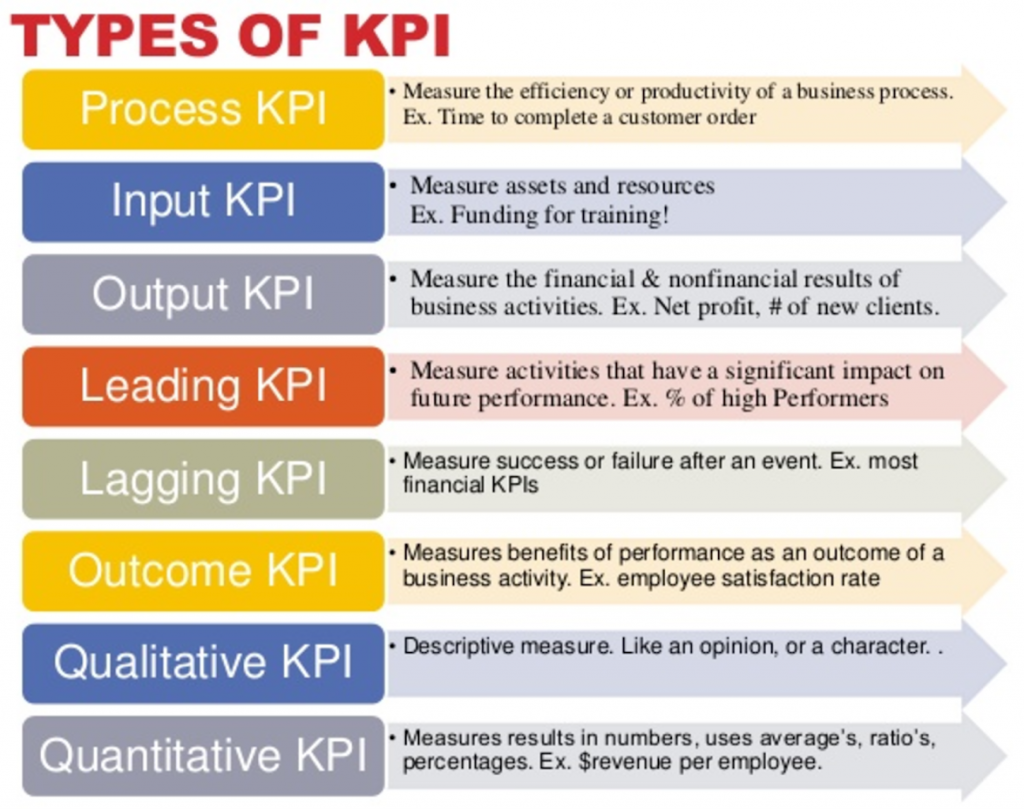
There are many types of key performance indicators. They can be qualitative, quantitative, predictive or based on the past.
KPIs also affect various business operations. Regarding the online environment, KPIs generally fall into one of the following categories:
- Sales KPI.
- KPI of SEO.
- KPI of Marketing.
- KPI for Customer Satisfaction.
- Manufacturing activities.
- Project management
Examples of KPI Indicators
There are already many KPIs that can be chosen for your business, and if one is chosen incorrectly, you risk measuring something that does not align with the goals you have. The best way to select the right business indicators is by researching and understanding several such KPIs to see which ones best suit the industry in which you operate.
Specialized KPIs for online sales
Key sales performance indicators are measurements that tell you how your business is doing in terms of conversions and revenue. You can analyze the sales KPIs related to a certain channel, time period, team, employee, etc. to make the best business decisions.
Key performance indicators for sales include:
Total sales: those who have e-commerce as a business can monitor total sales by hour, day, week, month, quarter, or year.
Average order size: Sometimes called the average market basket, the average order size says how much a customer usually spends on a single order.
Gross profit: GP is calculated by subtracting the total cost of goods sold from the total sales.
Average margin: The average margin or average profit margin is a percentage that represents the profit margin over a period of time.
The number of transactions: This KPI is used in combination with the average order size or the total number of site visitors for more detailed information.
Conversion rate: The conversion rate, also a percentage, is the rate at which users of the e-commerce site convert (or buy). This is calculated by dividing the total number of visitors (to a site, page, category, or page selection) by the total number of conversions.
Shopping Cart Abandonment Rate: The shopping cart abandonment rate says how many users add products to their shopping cart, but don’t check. The smaller this number, the better. If the dropout rate is high, there may be too much indecision in the completion process.
New customer orders vs. Recurring Customers: This value indicates a comparison between new and returning customers. Many business owners focus only on acquiring new customers, but retaining old customers can lead to much higher profit rates.
Cost of goods sold (COGS): COGS will tell you how much you spend to sell a product. This includes manufacturing costs, employee salaries, and overheads.
What are the key performance indicators for customer service?
KPI customer services tell you how efficient the customer is and if you manage to live up to their expectations.
You may be wondering: what should the KPIs for a call center look like, for the email support team, for the social support team, etc., and tracking these performance indicators will help you make sure you provide a positive customer experience.
Key performance indicators for customer satisfaction include:
Customer Satisfaction Score (CSAT): The CSAT KPI is usually measured by customer responses to a very common survey question: “How satisfied were you with your experience?” This is generally answered with a numbered scale.
Promoter Net Score (NPS): Your NPS KPI provides information about customer relationships and loyalty, telling you to what extent customers will recommend the brand to friends, acquaintances, etc.
Success rate: calculate the success rate by taking the total number of sales of a single product and dividing it by the number of customers who contacted the customer service team about that product.
The number of emails for customer service: This is the number of emails that the customer support team receives.
The number of customer service calls: Instead of e-mail, this is how often the customer support team is contacted by phone.
The number of customer service chat messages: If you have live chat on the e-commerce site, you may have a number of customer service chats.
Response time to requests: The response time is the average time required for a customer to receive the first answer to his question.
Average time to solve a problem: this is the time required to solve a customer support problem, starting from the point where the customer reached this problem.
Active issues: the total number of active issues indicates the number of questions that are in progress.
Backlogs: Backlogs appear when problems are “forgotten” in the system. This could be caused by a number of factors.
Classification of concerns: Beyond the total number of customer support interactions, consult the quantitative data around trends to see if you can be proactive and reduce customer support questions. You will classify customer concerns, which will help you identify trends and progress in solving problems.
Service escalation rate: The KPI service escalation rate indicates how many times a customer has asked a customer service representative to redirect them to a supervisor or other senior employee. It would be preferable to keep this number low.
The importance of key performance indicators for SEO
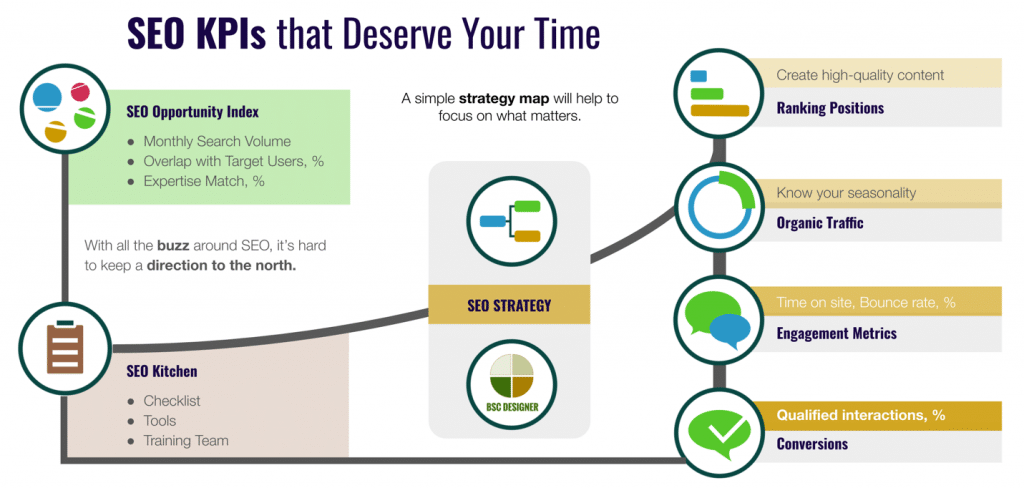
Measuring the results of your business is a critical component of any SEO campaign.
There are many, many variables at play in an SEO campaign, so successful campaigns rely on a control system to ensure that the work is done yields results.
Key performance indicators (KPIs) act as this control system and allow you to identify what works – and often, more importantly, give the SEO process an early warning system if something does not evolve as expected.
Web Page Ranking
Ranking the pages of the site on SERPs (Search Engine Results Pages) is the indicator that demonstrates how well the page has been optimized and what kind of subject authority the website itself has gained.
An excellent way to evaluate this KPI is through the Google Search Console, where you can see how many impressions are generated by certain keywords on your site, as well as where each page of the site ranks on them and whether users click. If you have an allocated budget, you can also use paid SEO tools to be able to monitor the evolution of your keywords.
In other wor ds, content created to answer users’ questions will probably have a much better chance of ranking than content built to rank keywords.
Organic Search Performance
Organic search results are listings on SERPs that appear when users search for specific information and reach a page on the website because of the relevance of the content, not because of the paid ads.
Organic search performance is often the most important key performance indicator for digital marketing teams interested in input results.
Page Upload Speed
Web page loading speed is an indic ator that demonstrates an important aspect of website performance. As reported by Search Engine Land, Google has made the speed of the site a ranking factor since 2010. If a web page takes a long time to load, you create a poor experience for the visitor and for the factors page ranking.
Number of Indexed Pages
Robots.txt and sitemap.xml are files that restrict Google crawlers on all web pages. If Google crawlers are not allowed to crawl the site, then how is it possible for Google to index all web pages on the site?
Controlling and optimi zing robots.txt and sitemap files allows Google crawlers to visit the site in the right way. If you publish a post/blog and submit it to the Google Search Console, Google can immediately assess who the author is, what the title is, and where the publication’s name is displayed (among other qualities, the content will have a much better chance of ranking.
Pages per Session
This indicator shows how many visitors are looking at a session on your website and how many pages. The number of pages viewed dur ing a session is an indicator of the quality of your site, as well as its ability to attract visitors and create conversions.
Conversion
These are the most important actions for your site, regardless of the niche. While a visit is enjoyable, getting conversions (any action taken by the visitor that provides a point of contact) and a sale is optimal.
Examples of conversion types:
- Provides an e-mail (often by subscribing to a newsletter or blog).
- Sign up for a webinar.
- Download an eBook.
- Form completed asking a question.
- Sale.
Time on Site
Time spent on the site ➡ this KPI indicates the time spent by visitors on your website. In general, more time spent means having a greater commitment to your brand. You will usually want to see more time spent on blog content and landing pages and less time spent checking out.
Bounce Rate
Bounce rate ➡ tells us how many users leave the site after viewing a single page. If this number is high, you will want to research why visitors leave the site instead of browsing it.
Average Session Duration
The average period of time that a person spends on the site, during a single visit, is called the average duration of the session.
Traffic Source
The KPI traffic source tells us where your visitors are coming from or how they found your site. It will provide information about the channels that generate the most traffic, such as organic searches, paid social media ads, newsletters, etc.
Mobile traffic
The traffic coming from the mobile variants of the sites came to mean up to 90% of the total traffic. This represents the total number of users who use mobile devices to access the online store, so make sure the site is optimized for mobile.
Conclusions
Tracking key performance indicators ➡ KPIs in the area of online marketing can help you validate everything you do as a business professional, whether you work in the B2C or B2B world. If you have chosen to work with an online marketing agency, then it is advisable to know what performance indicators to follow to make sure things are going in the right direction.
It is essential to know both the successes and the challenges in the business, in order to make the best decisions, which can lead to progress and evolution.
What KPI performance indicators do you follow in online marketing campaigns?